Elastic Search
Elastic Stack
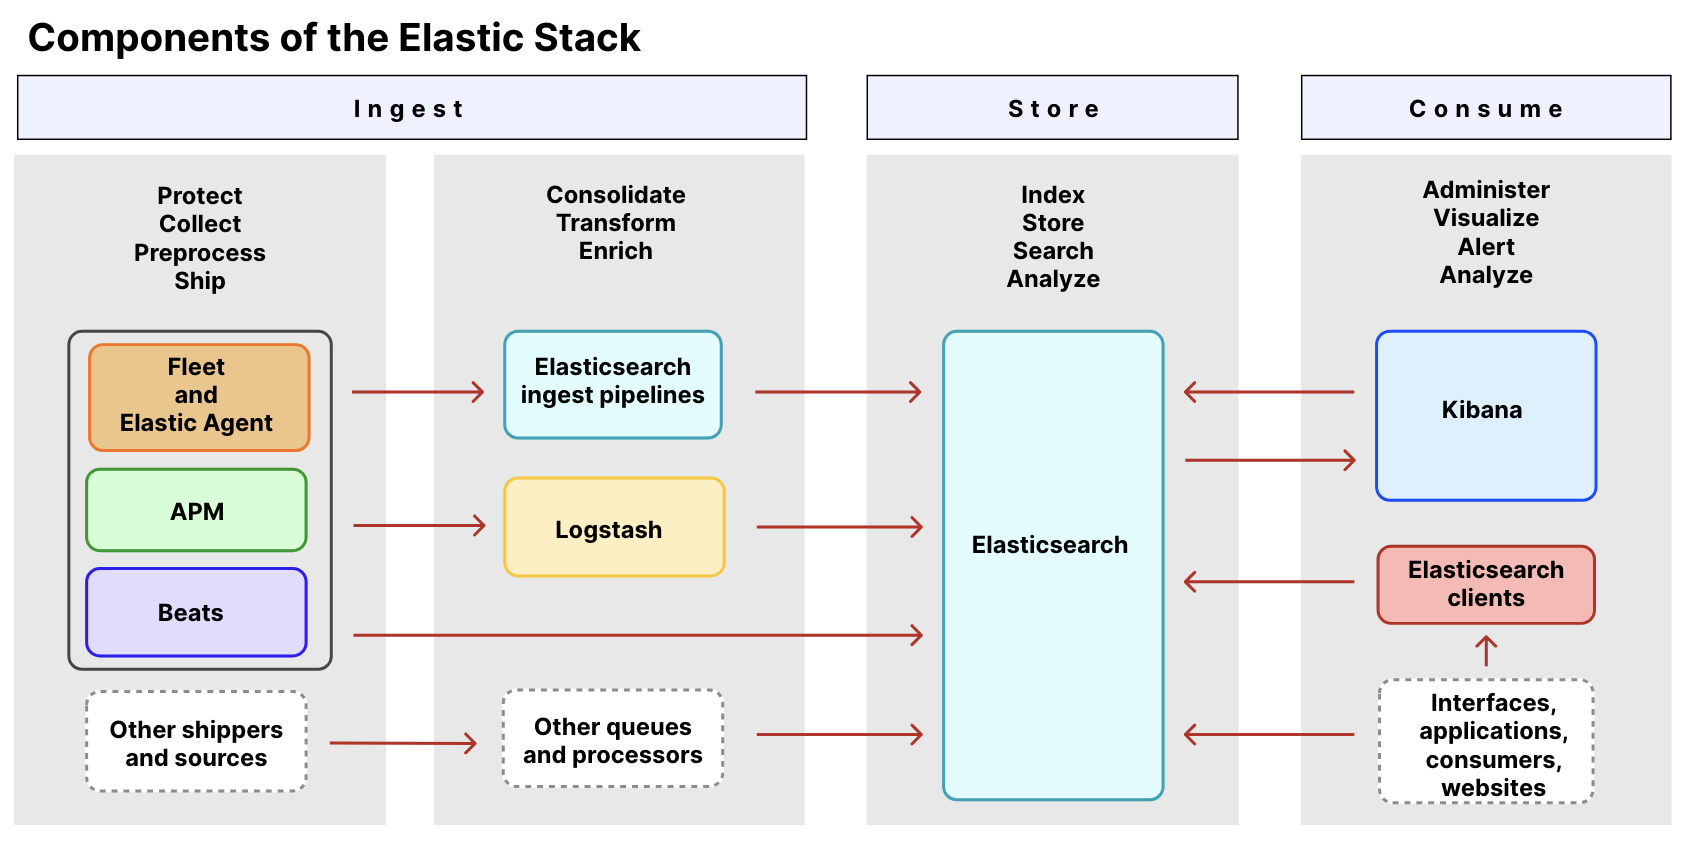
- Includes components like: Elasticsearch, Kibana, Beats, Logstash (used for transformation) and others
Kibana
- Visualization tool for Elasticsearch
- Seems like “Discover” and “Visualization > logs” are the same thing
Observability > APM list down multiple services and nodes- BY:
labels.stratosphere-resource-nametenantName
Metrics
Beats
- Elasticsearch Beats are light weight, purpose-built agents that acquire data and then feed it to Elasticsearch
- Based on
libbeat framework
- Official Beats from Elastic:
- Filebeat: logs
- read files from system. good for system and app logs
- Logstash is used for transformation of data received from Filebeat
- Metricbeat: metrics
- collects metrics from servers and systems
- Packbeat: network
- network packet analyzer
- monitors network protocols to enable users to check on network latency, errors, response times, SLA performance, user access patterns and more.
- Winlogbeat: windows events
- provide live streams of Windows event logs.
- It can act as a security enhancement tool and be used by the company to monitor everything happening on its employees system
- Auditbeat: linux events
- Similar to Winlogbeat, but for linux
- Heartbeat: uptime
- Monitors uptime of services by basically pinging them and then ships the data to Elasticsearch.
- It can ping using ICMP, TCP and HTTP
Kibana vs Prometheus vs Grafana
- Kibana is based on Elasticsearch database
- Grafana is based on Graphite datasource
- Grafana additionally supports wide range of data sources including elasticsearch
- Prometheus is used for monitoring and has high reliability